Know why things break before your team wakes up
A background worker watches your logs around the clock. When something breaks, it SSHes in, traces the error, and queues root cause for your team.
The analysis runs while you sleep.
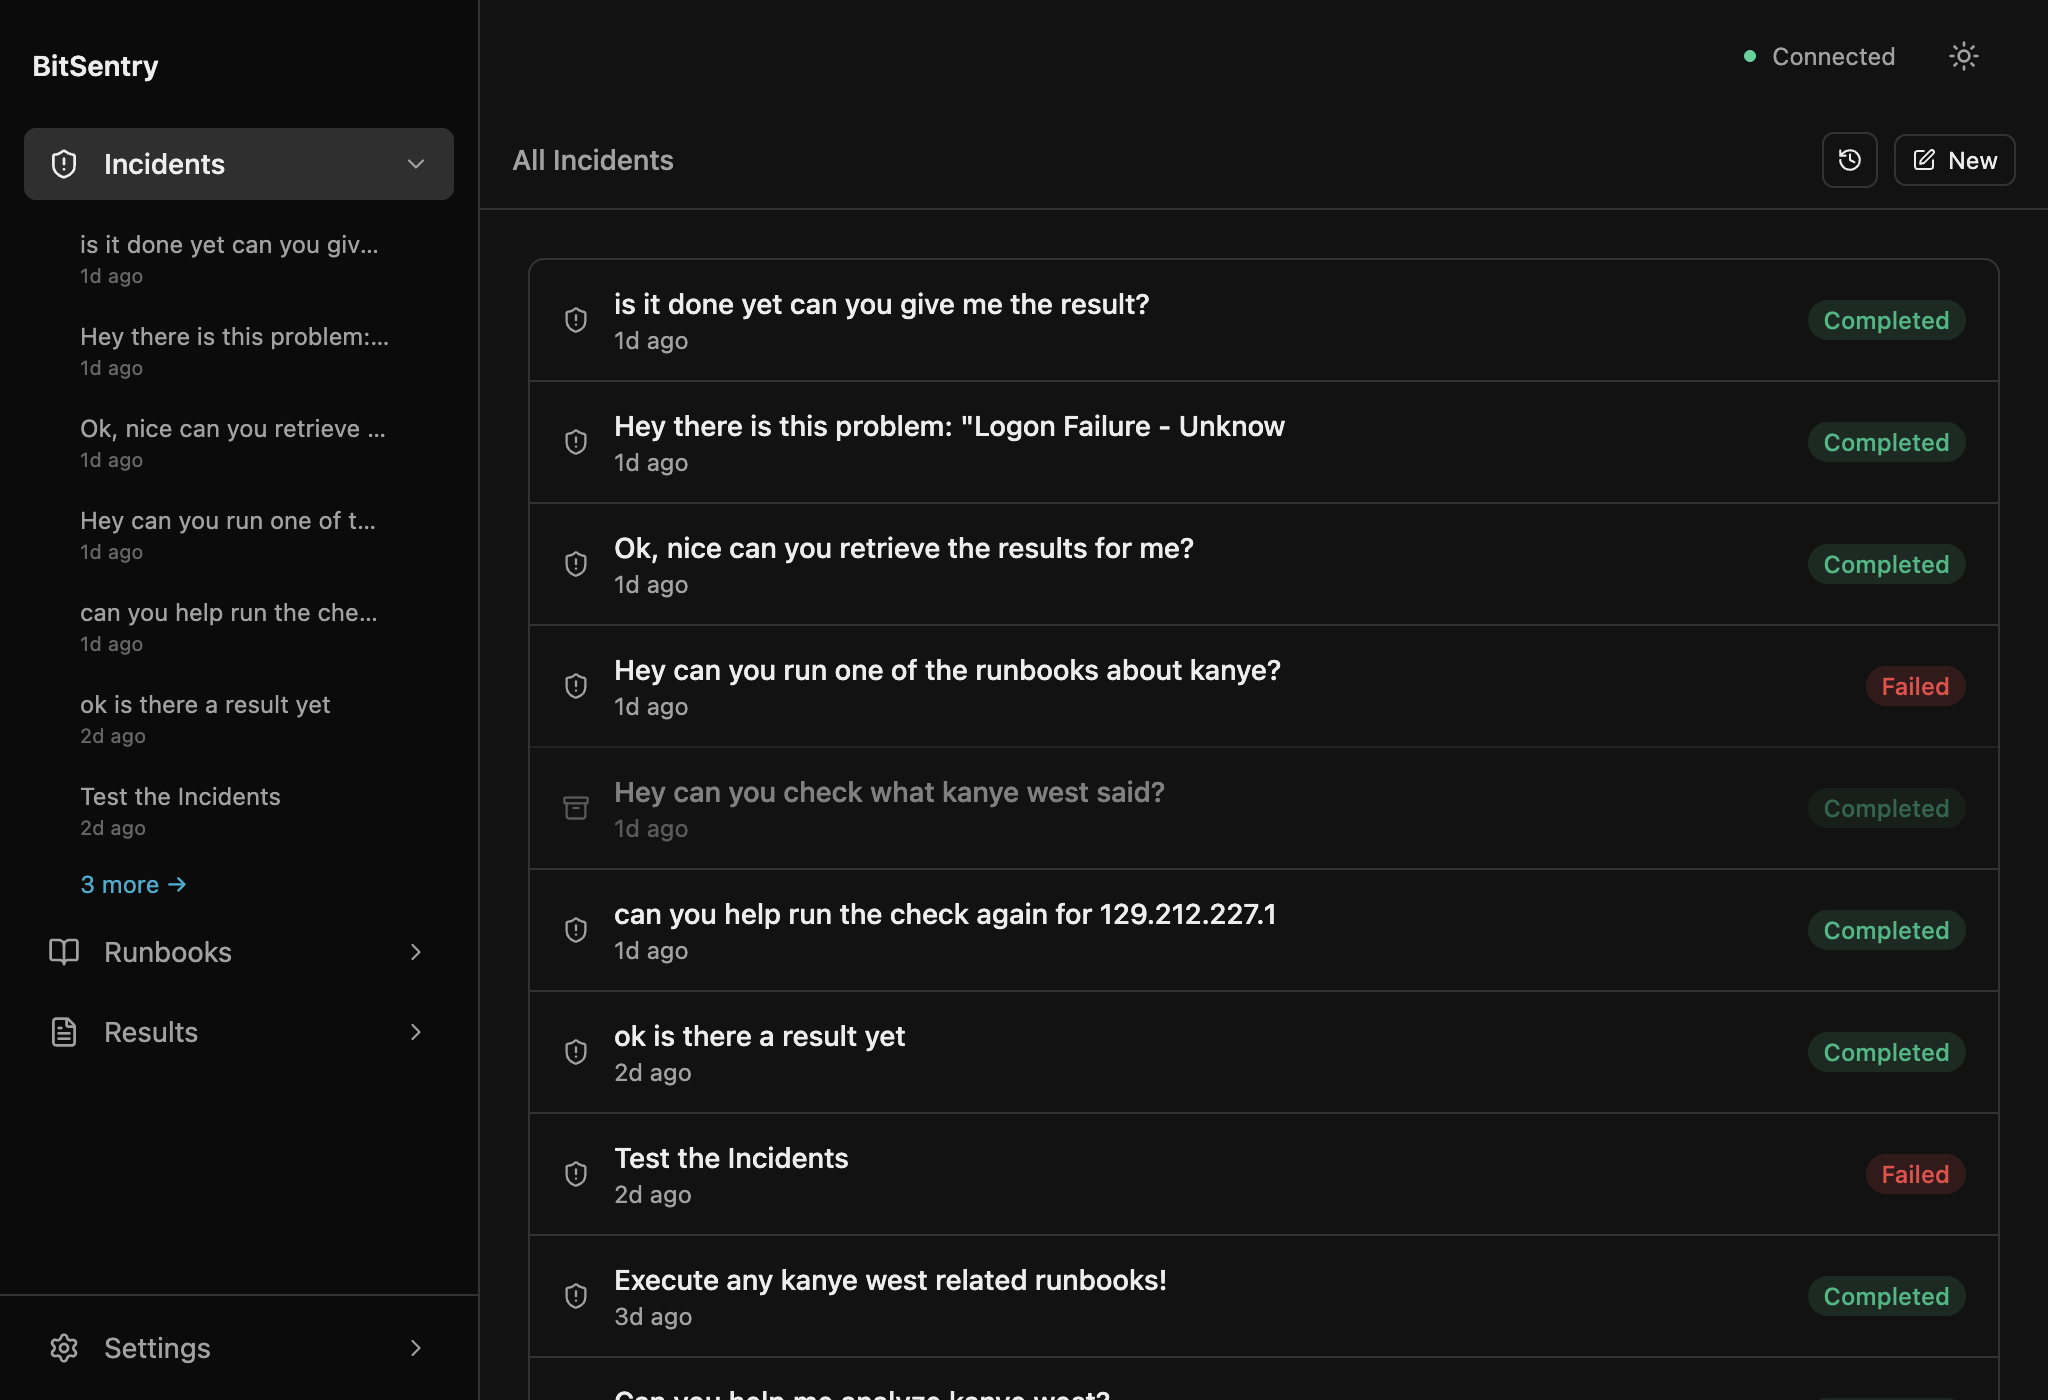
Open the dashboard.
Answers are already there.
BitSentry ingests logs from Sentry, PagerDuty, Datadog, and others. The background worker investigates anomalies and surfaces root causes before you touch the keyboard.
24/7 Background Worker
Runs 24/7. Triages events, investigates anomalies, queues root causes for your team.
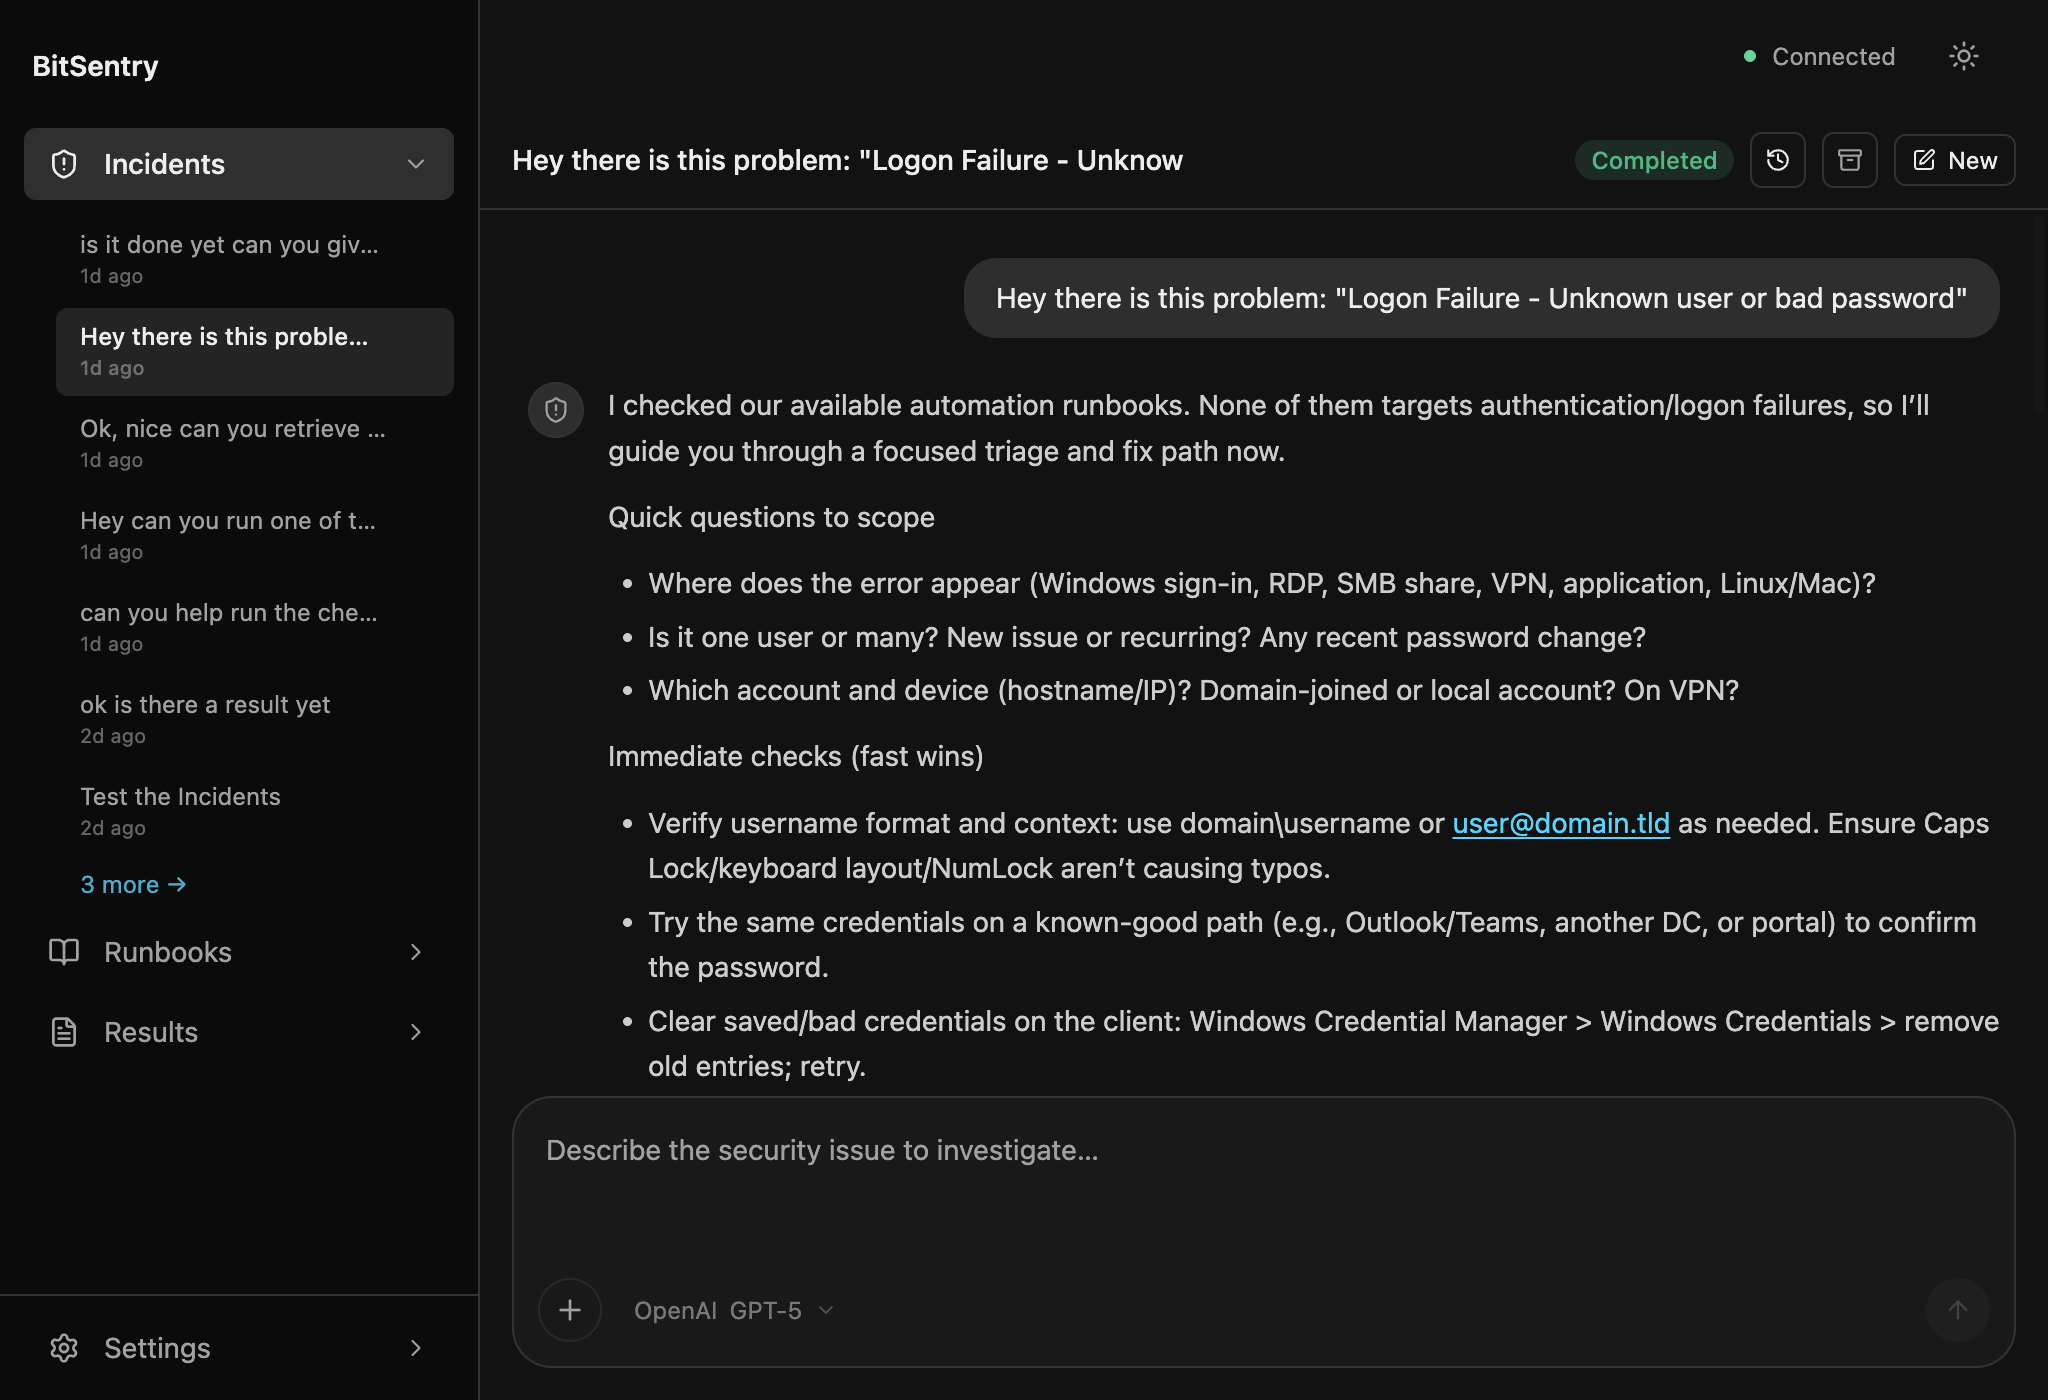
Automated Root Cause Analysis
AI traces errors to their source. Clear root cause for every anomaly, no guessing.
Full Observability
Incidents, metrics, agent health, and compliance. One view.
Everything SuperTerminal does
Plus a worker that never stops investigating
SuperTerminal runs when you open it. The dashboard doesn't wait. It watches your logs around the clock and queues root cause analysis for your team.
Always On
You don't have to be watching. The worker never stops.
Ahead of the alert
Issues caught before they page anyone. Root causes queued before you check.
Team-Wide Visibility
Shared dashboard. Your whole team sees investigations and root causes. Just a browser, no VPN.
From logs to root cause
Plug in your logs, let the worker run
Connect Your Log Sources
Plug in Sentry, Datadog, PagerDuty, or any log source. Takes minutes.
AI Investigates Automatically
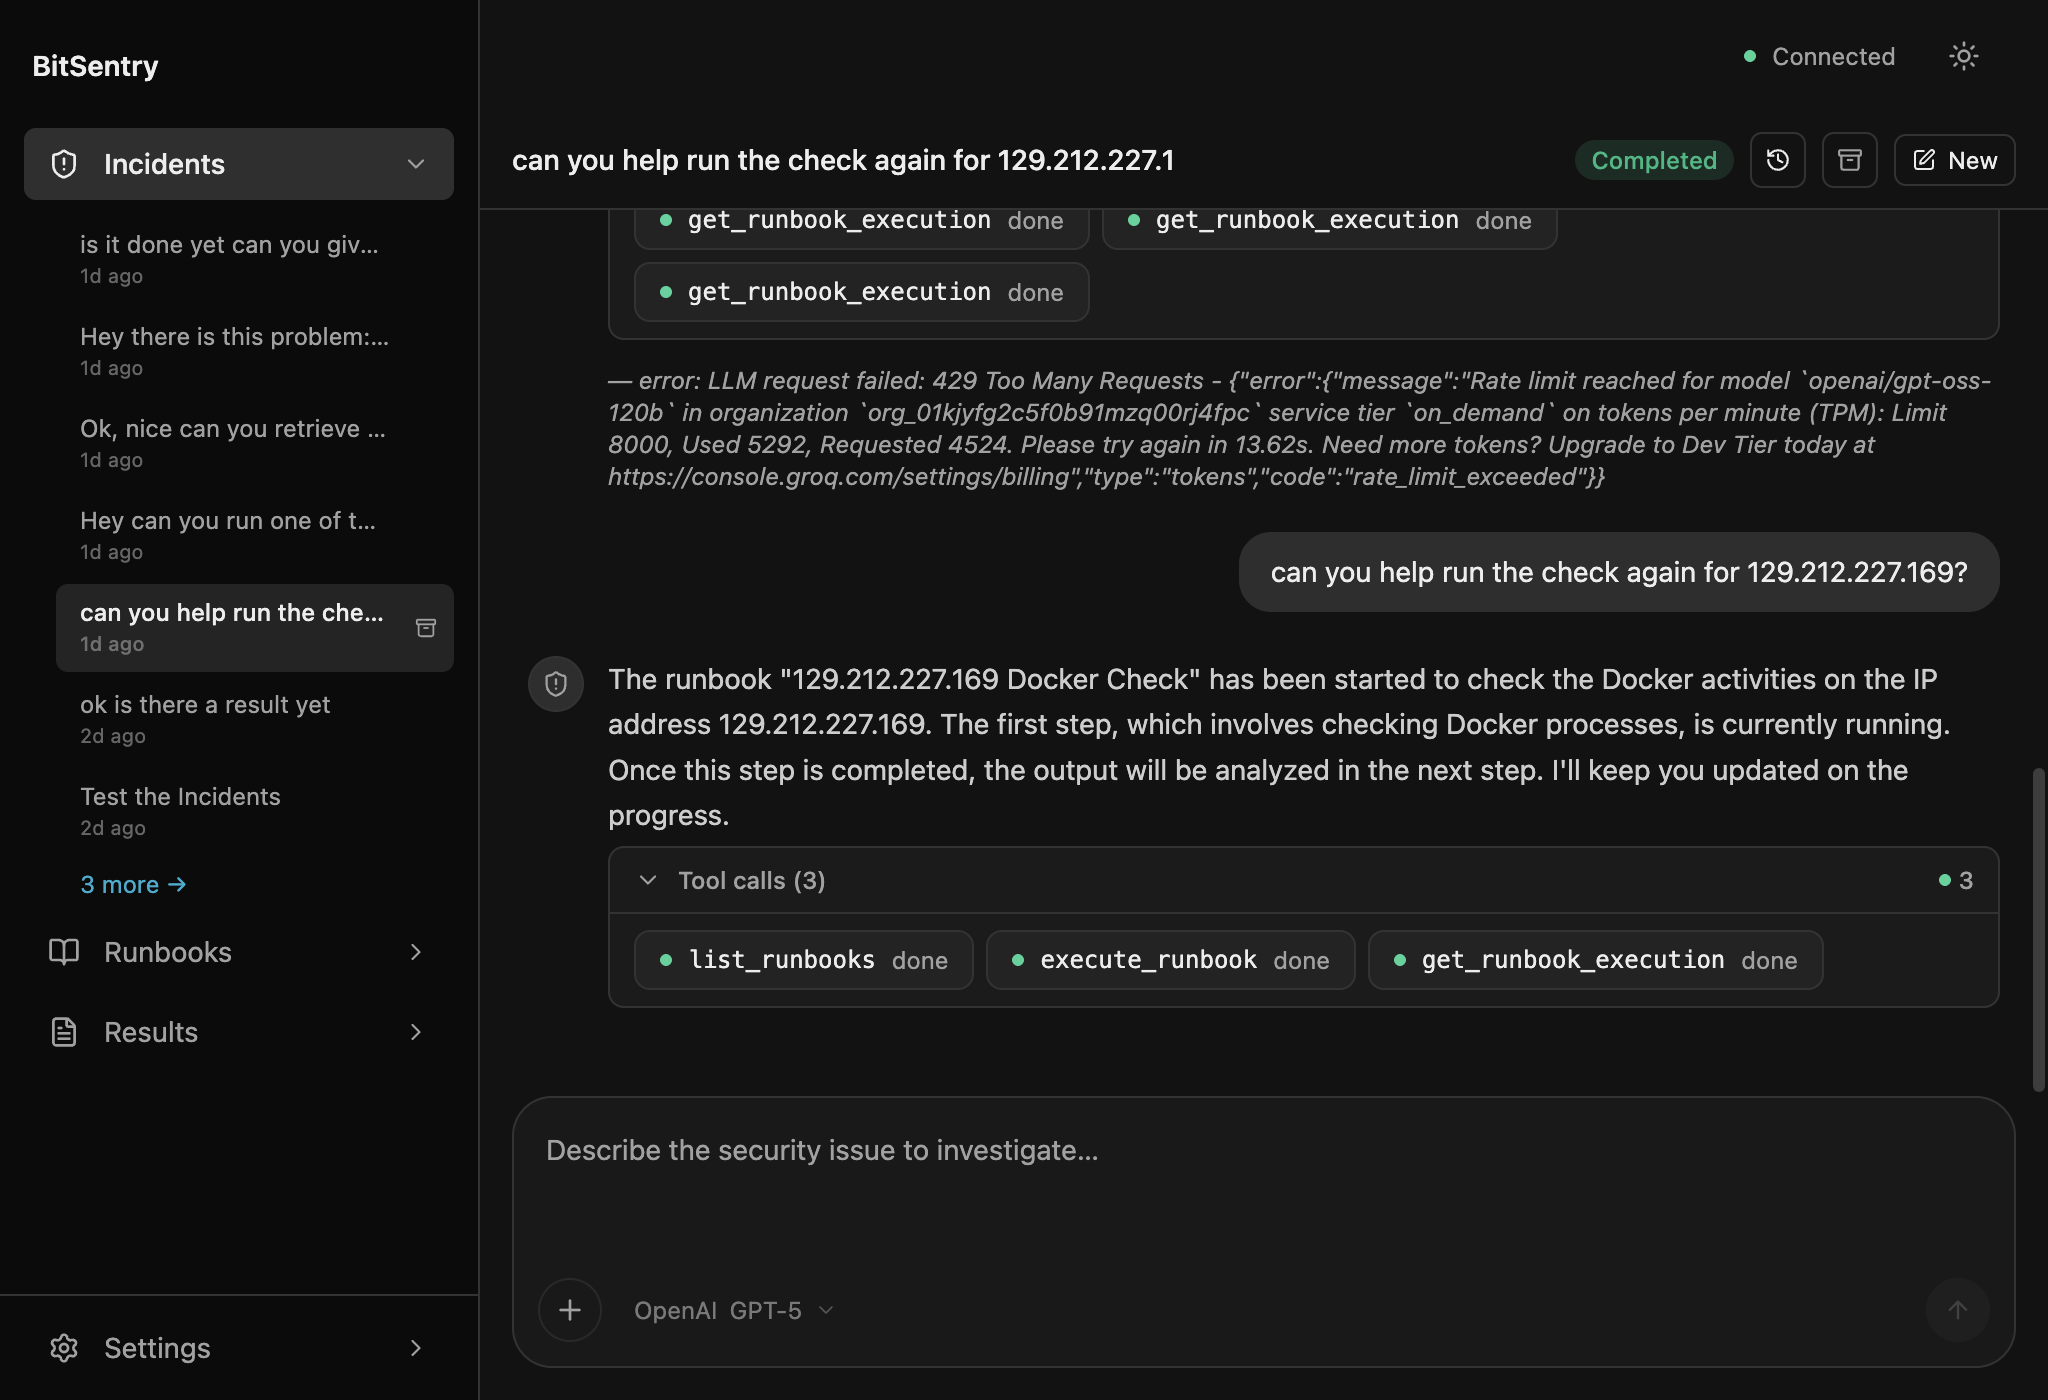
When something looks off, AI SSHs into your servers, pulls logs, and surfaces root cause. Before your phone buzzes.
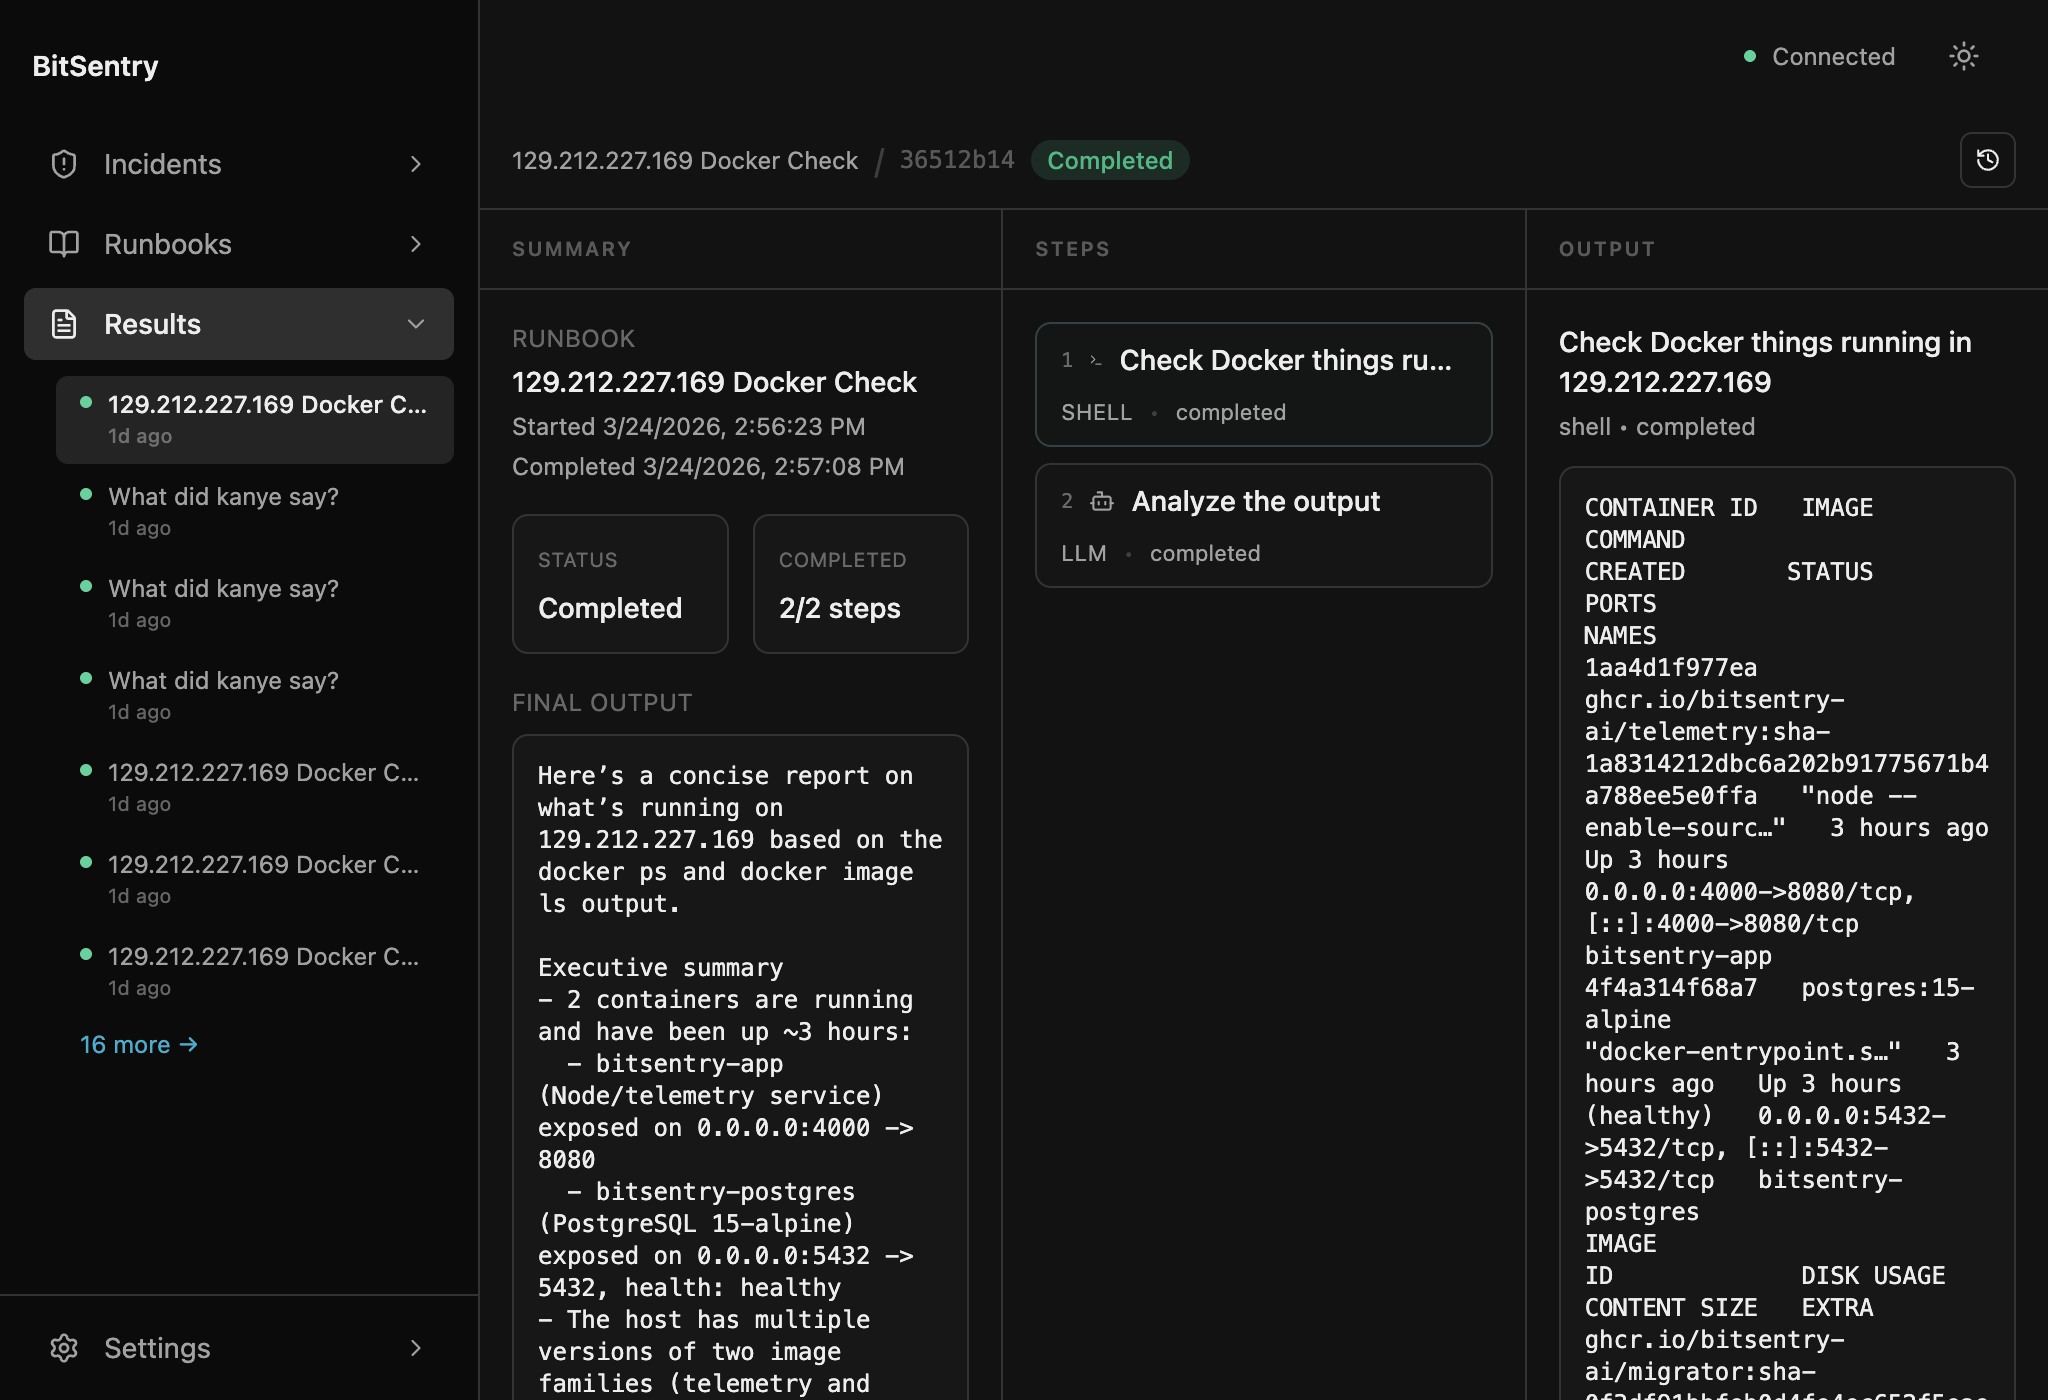
Review Results and Act
Every investigation logged. Review findings, run runbooks, or close the incident from the dashboard.
Full Observability Stack
What your team gets on day one
Root Cause Analysis
AI traces errors across services and tells you what broke and why.
Incident Management
Track open incidents, link to runbook results, and close issues from the dashboard without opening a terminal.
Reusable Runbooks
Build multi-step runbooks that chain shell commands, AI prompts, and HTTP calls. Execute them from the web.
Metrics & Compliance
Incident metrics, compliance tracking, agent health, and infrastructure status, updated continuously.
Connects to Your Tools
Continuous ingestion from your monitoring and security tools. The background worker processes data 24/7.
Error Sources (continuous)
- Sentry
- Wazuh
- PagerDuty soon
- Datadog soon
Monitoring (continuous)
- Grafana soon
- Prometheus soon
- New Relic soon
- SigNoz soon
Security Scanning
- SonarQube soon
- OWASP ZAP soon
- GitHub CVE Alerts soon
Ticketing
- Jira
- ClickUp
- Trello
- Slack soon
Codebase (RCA context)
- GitHub soon
Your Logs, Your Infrastructure
The dashboard runs on your terms. Self-host it or use our managed deployment. Either way, your data stays yours.
Encrypted at Rest
All investigation data, logs, and credentials are encrypted. Your infrastructure details never leave your deployment.
Full Audit Trail
AI decisions, commands executed, and root causes are all logged and reviewable for compliance.
Self-Hosted Option
Deploy the dashboard on your own infrastructure. Your data stays where you put it.
Get Early Access
to the Dashboard
We're onboarding a limited number of teams. Early adopters get hands-on setup and pilot pricing.
Get Early Access
Tell us about your stack and what you're monitoring.
Connect Your Logs
We'll help you plug in Sentry, Datadog, or your log sources.
Review Root Causes
The worker starts analyzing. Open the dashboard and check findings.
We'll follow up with a short fit assessment.