Shared diagnostic runbooks for ops teams.
Run background investigations, share runbooks, review risky actions, and keep every command, output, and AI response in an audit trail.
Limited Q3 cohort — 1 to 3 teams.
Positioning
An investigation layer
for your existing observability stack.
You already have logs, alerts, and dashboards. What you don't have is a shared, repeatable way to diagnose what they're showing you. BitSentry Team is that layer — it doesn't replace Datadog, Grafana, or Sentry. It tells you what to do when they fire.
Shared runbook library
One source of truth for how your team diagnoses production. New hires inherit tribal knowledge on day one.
Background investigations
When an alert matches a runbook, the worker runs it and queues an evidence-backed hypothesis before anyone opens their laptop.
Review + audit trail
Risky actions stay visible for human review. Every command, response, and AI output is recorded for compliance and review.
Always-on
Background investigations
for known incident patterns.
When an alert matches a runbook, BitSentry Team investigates automatically and queues an evidence-backed hypothesis. No magic. No invented commands. Just the deterministic checks you wrote, run in the background by a worker that doesn't sleep.
One library, every on-call
Stop rebuilding the same checks per engineer. Stop watching the senior engineer paste commands into Slack.
Ahead of the page
When alerts match a runbook, BitSentry Team has already run it by the time anyone reads the page.
Visibility without VPN
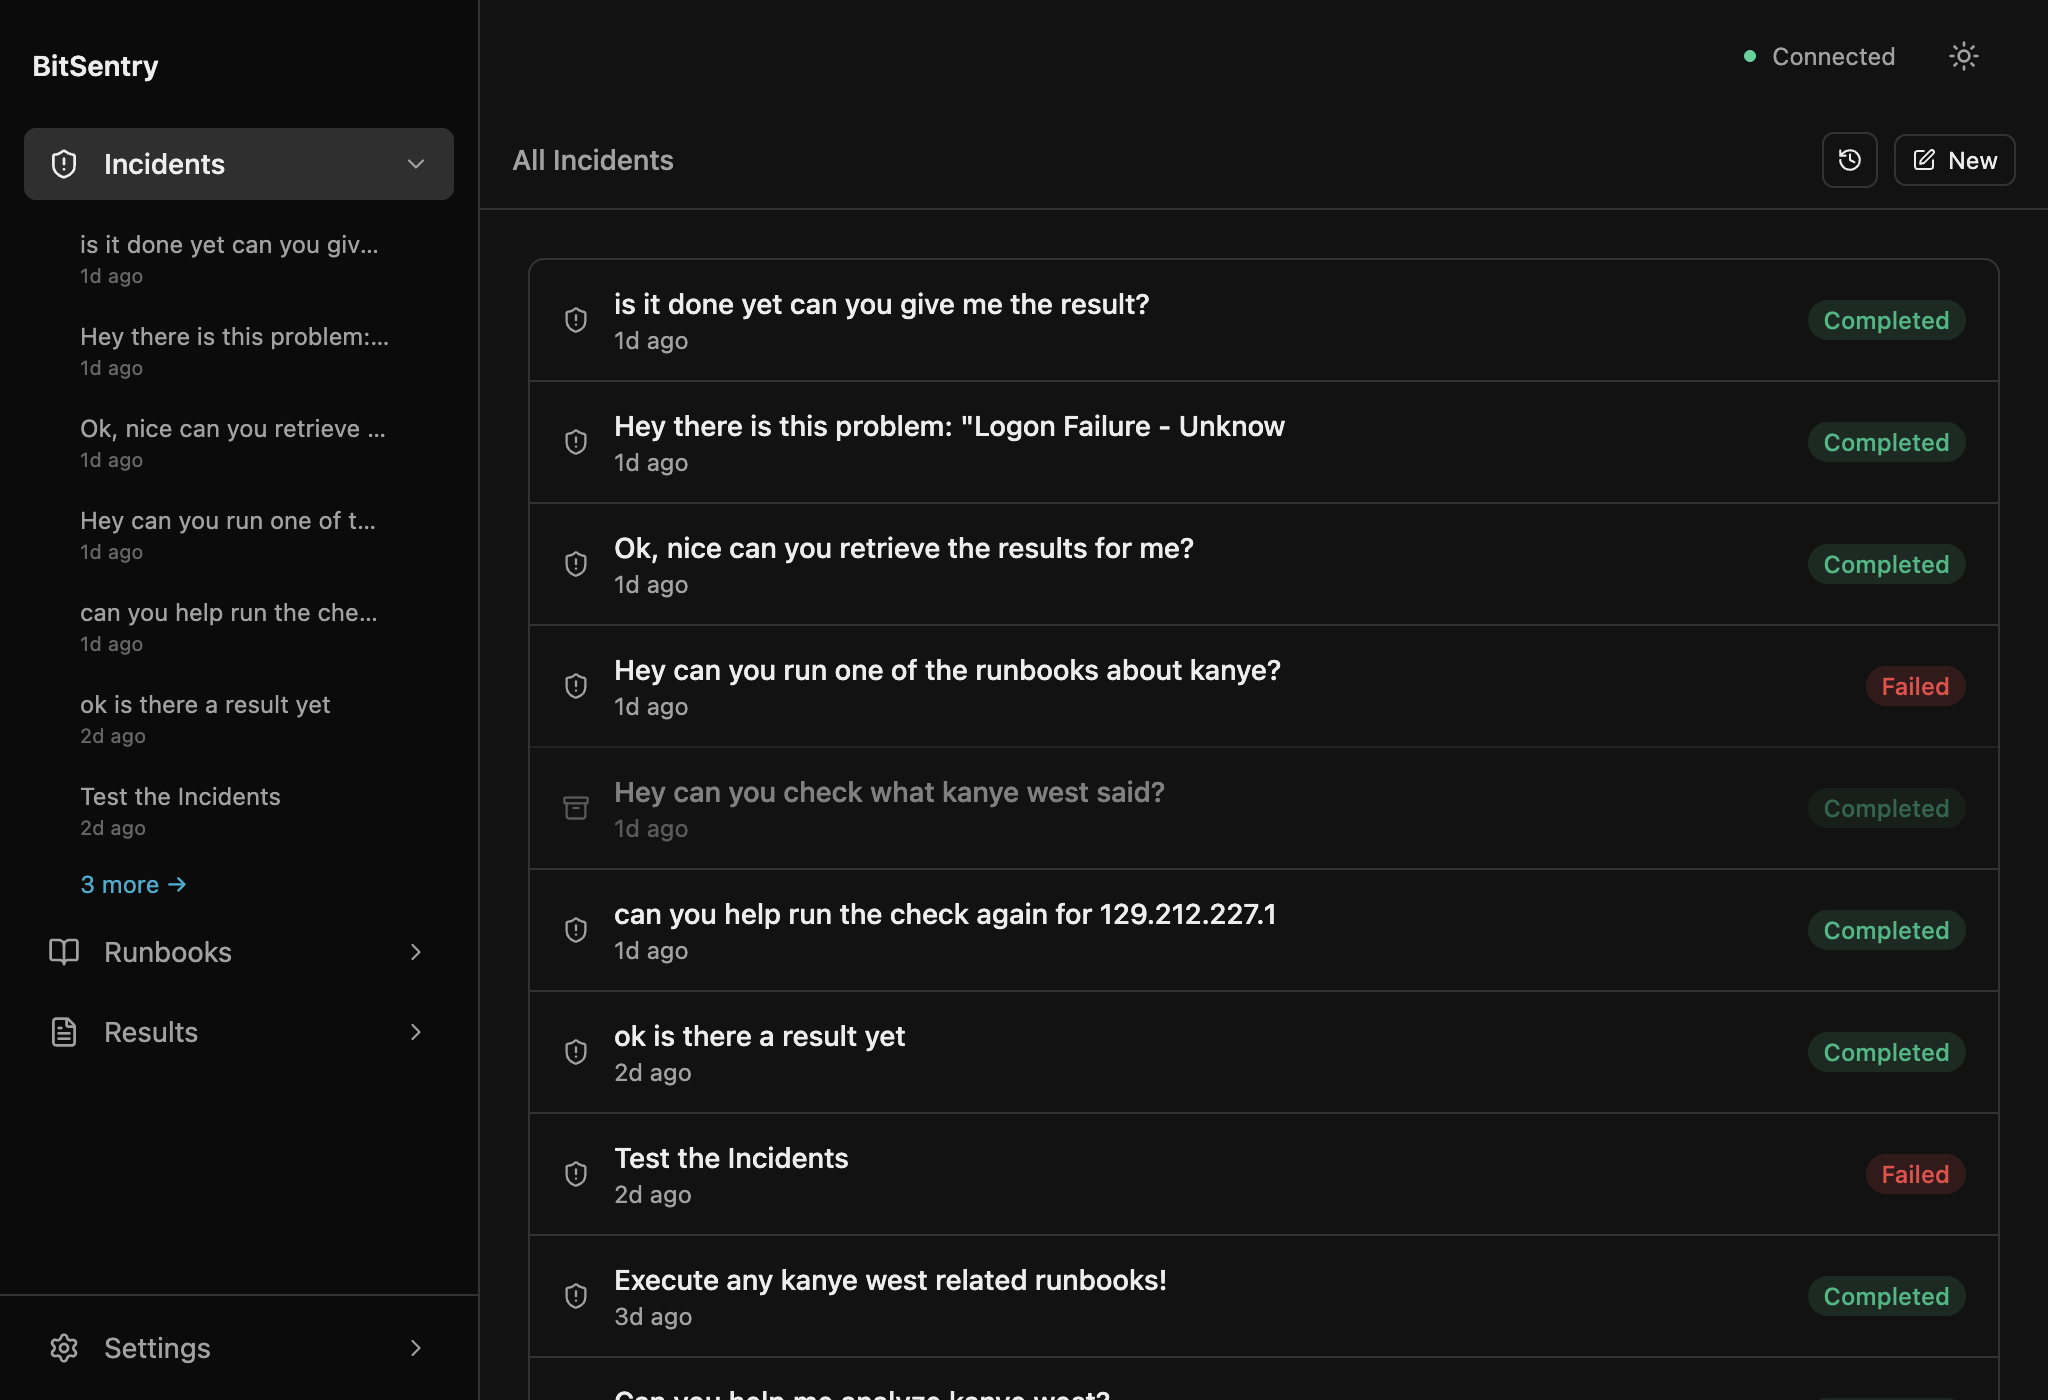
A browser is enough. Your team sees open investigations, evidence, and proposed remediations.
How it runs
From alert to hypothesis
while your team is asleep.
Codify a runbook your team already runs
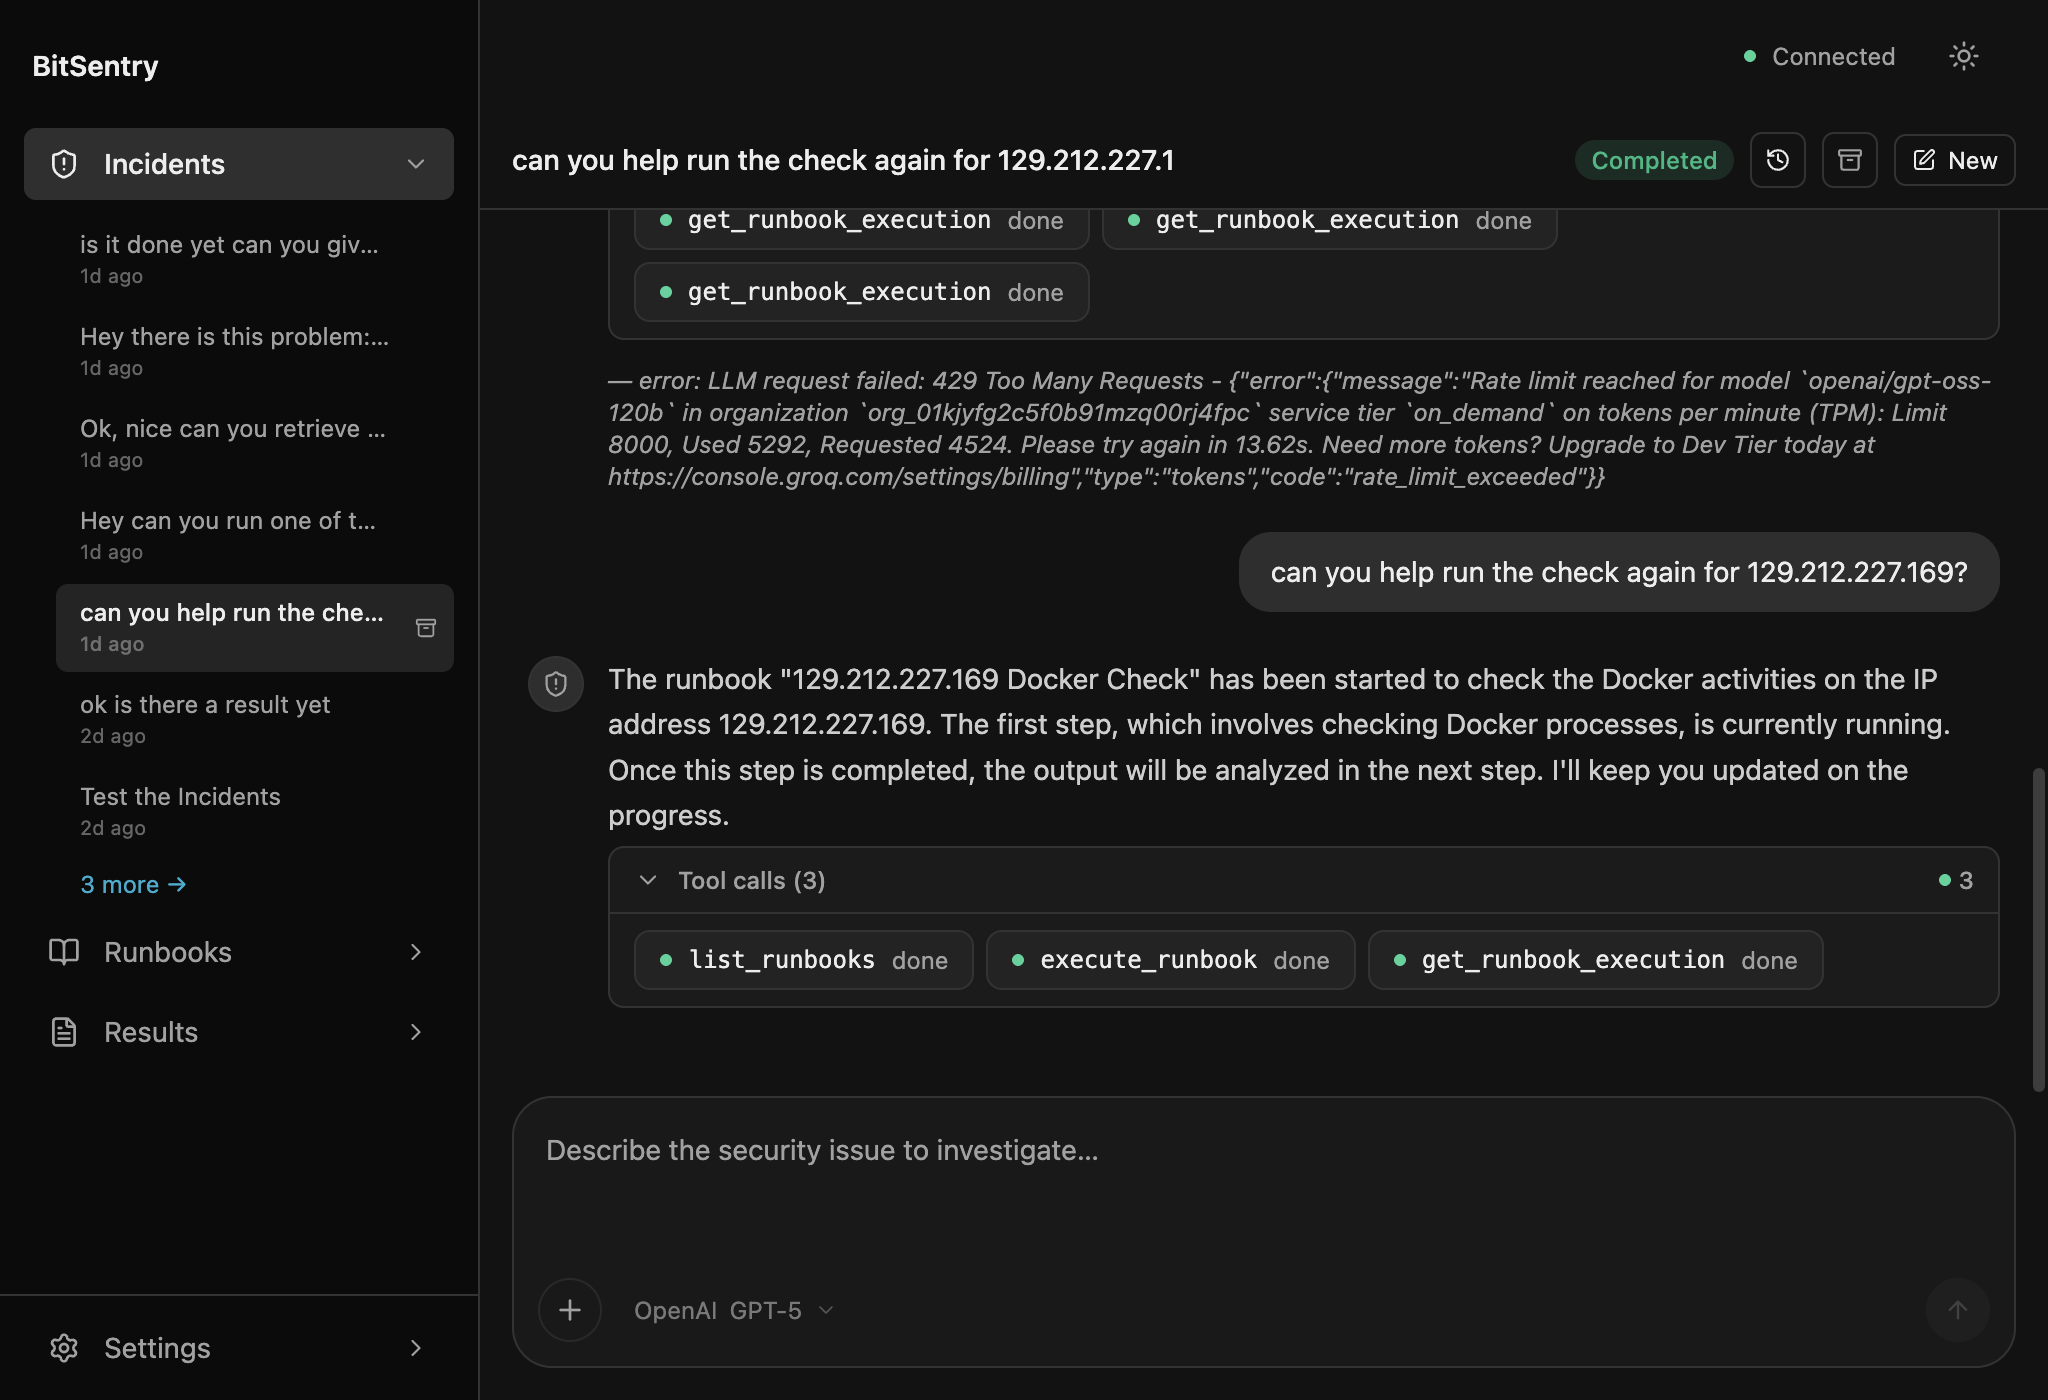
Drop in the SSH checks your senior engineer runs at 2am. Now everyone can run them.
Trigger from alerts you already trust
Wazuh, Sentry, or a webhook. When a matching alert fires, BitSentry Team runs the runbook automatically.
Review evidence, choose actions
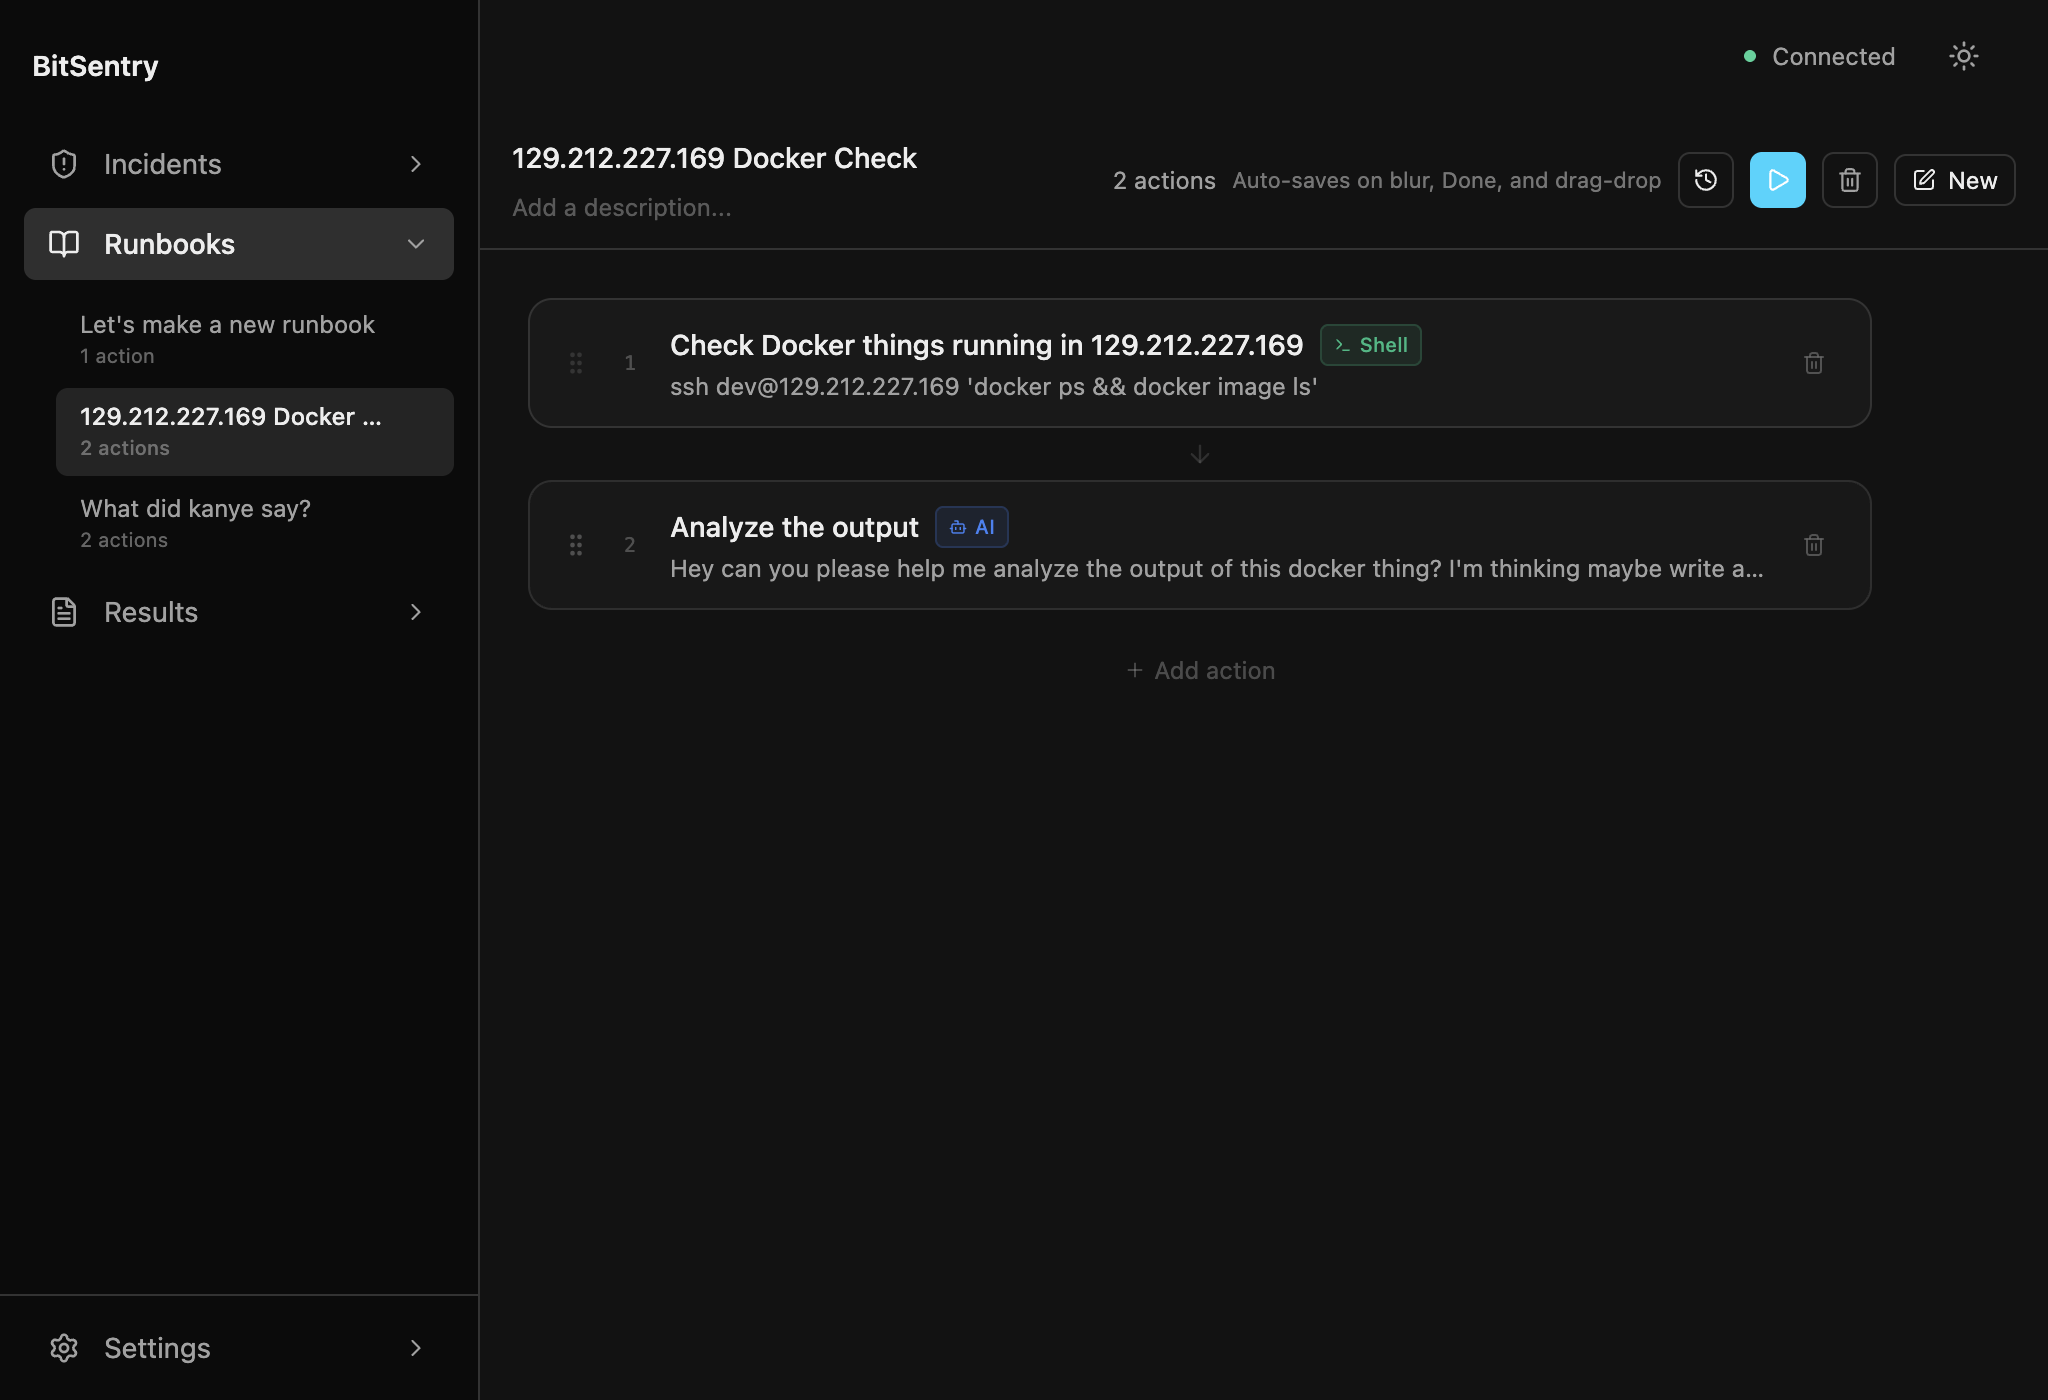
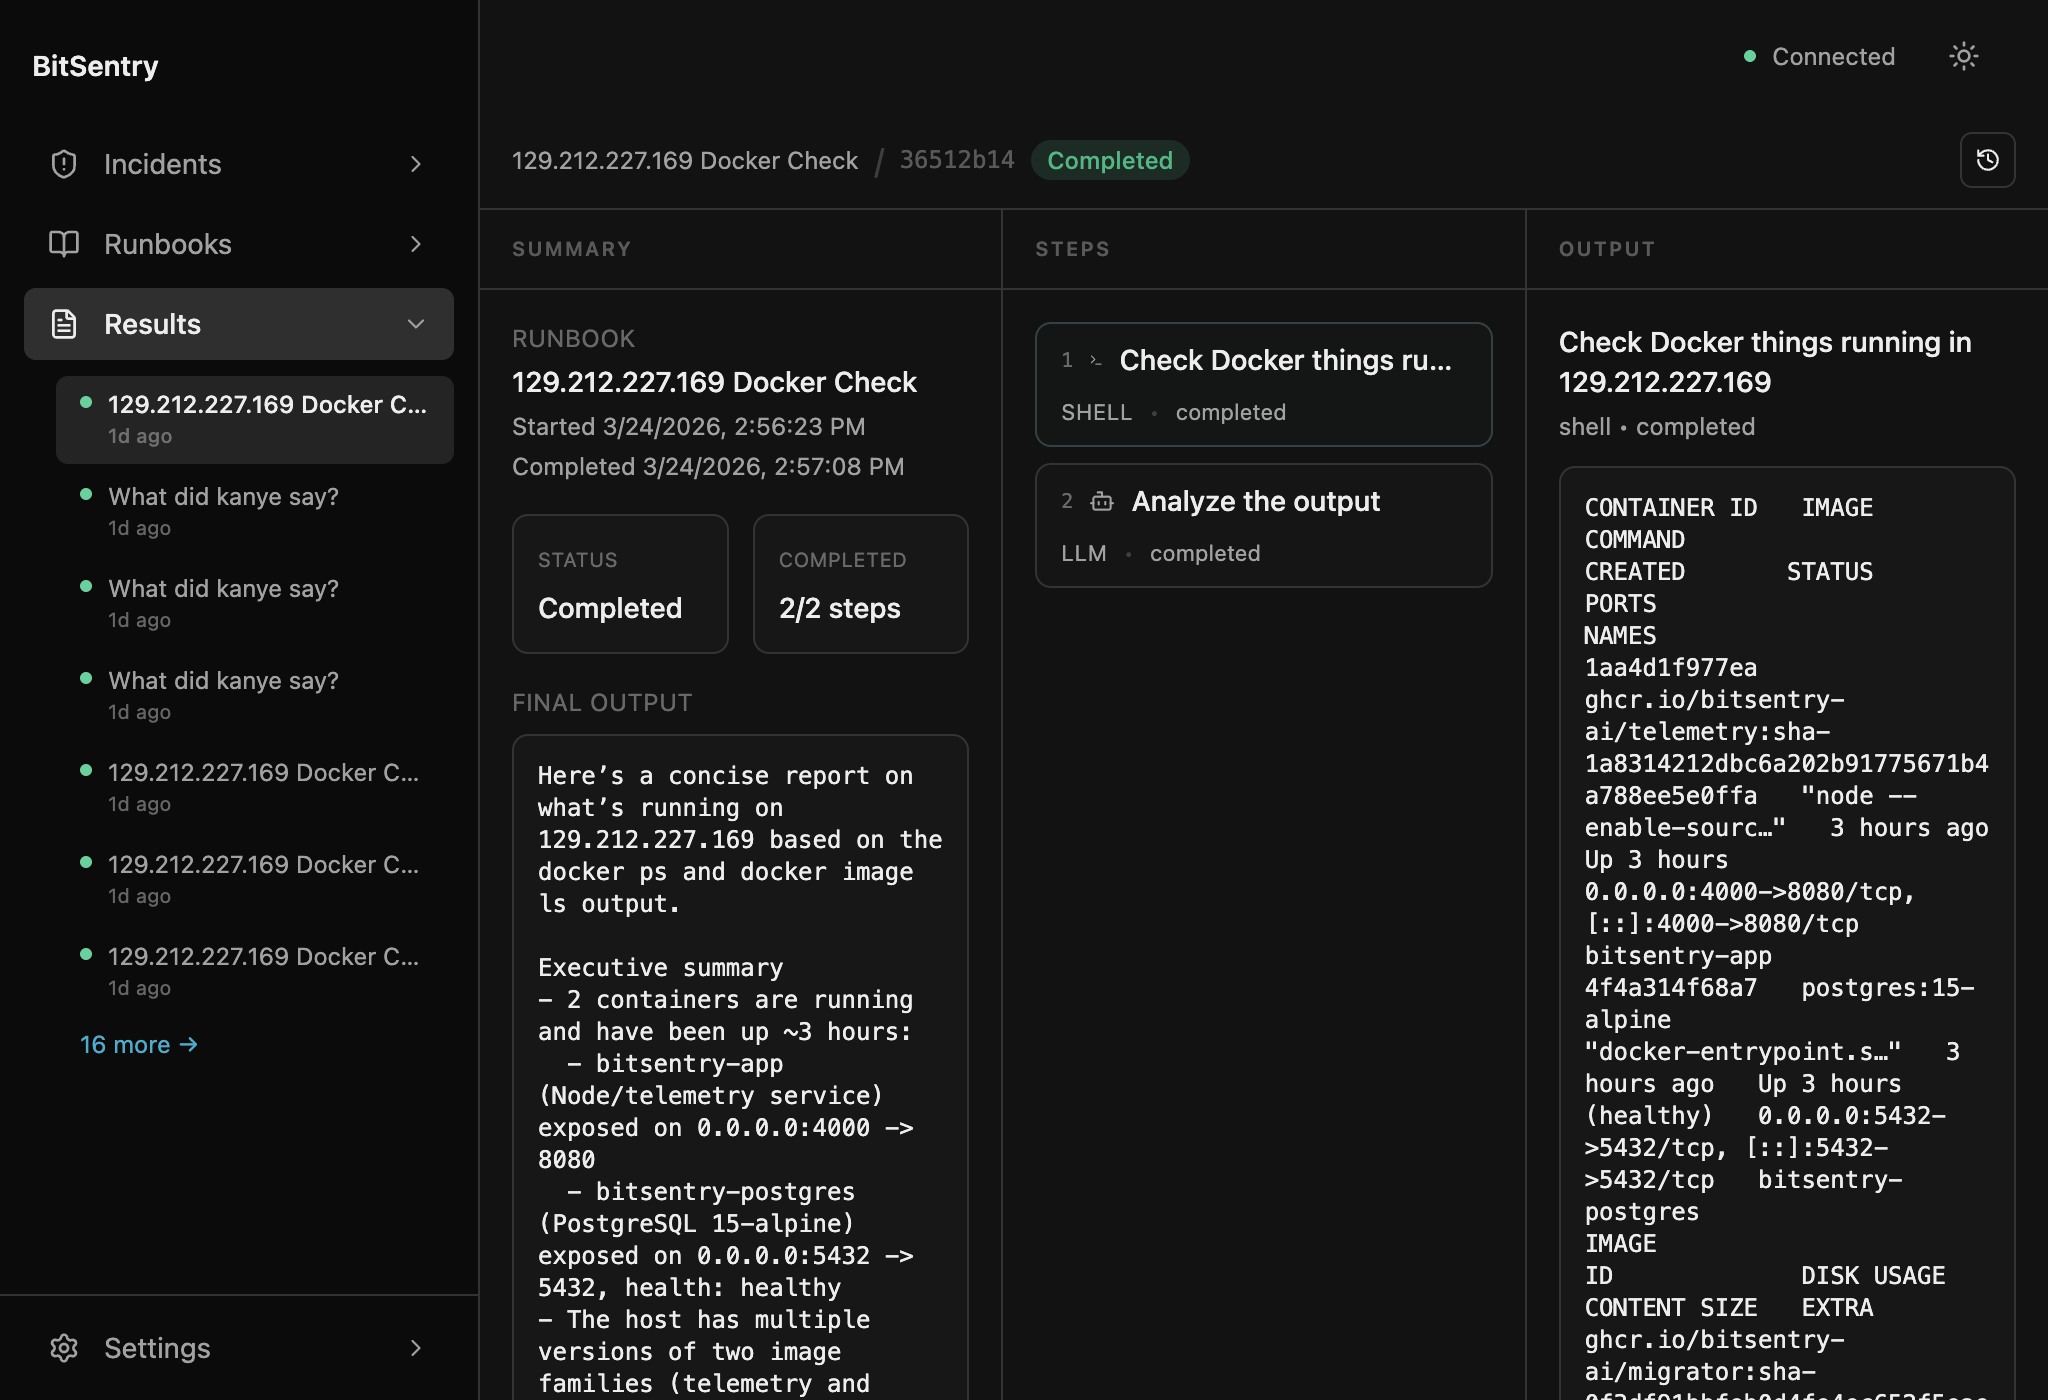
AI summarises what it found. Risky actions stay visible as human decisions, with every step logged for the post-mortem.
Before / After
What changes on day one.
Before BitSentry Team
After BitSentry Team
SSH into a server manually
Run a reviewed diagnostic runbook
Grep logs from memory
Repeatable, shared checks
Tribal knowledge in one engineer's head
AI explains the output to anyone
Slack thread full of guesses
Evidence-backed hypothesis
No consistent audit trail
Every step logged and reviewable
Integrations
Plugs into what you already run.
Continuous ingestion from your monitoring and security tools. The background worker processes data 24/7.
Error sources
- Sentry
- Wazuh
- PagerDuty soon
- Datadog soon
Monitoring
- Grafana soon
- Prometheus soon
- New Relic soon
- SigNoz soon
Ticketing
- Trello
- Jira soon
- ClickUp soon
- Slack soon
Codebase (RCA context)
- GitHub soon
Security scanning
- SonarQube soon
- OWASP ZAP soon
- GitHub CVE Alerts soon
Your runbooks, your perimeter.
BitSentry Team is available as a managed deployment today. If self-hosting is a hard requirement, talk to us about the Enterprise rollout path.
Encrypted at rest
Runbook content, command output, and credentials are encrypted at rest. External AI/provider calls depend on how you configure the deployment.
Full audit trail
AI outputs, commands executed, and hypotheses queued are all logged and exportable for compliance.
Enterprise deployment path
If self-hosting is a hard requirement, talk to us about the Enterprise rollout path.
Honest filter
BitSentry Team may
not be for you if...
We'd rather lose a fit call early than over-promise. If any of the below sounds like you, we're probably not the right tool today.
Your production lives on 1 to 3 servers and one senior engineer holds all the diagnosis knowledge. SSH + Claude is probably enough for you today.
You already have mature Datadog or PagerDuty automation that handles diagnosis end-to-end.
You don't SSH into servers, your workflow is managed Kubernetes consoles only.
You have a strict no-AI policy for operational data, even for read-only summarisation.
You need a fully on-prem solution today (self-hosted is on the roadmap, not shipped).
Book a Diagnostic Runbook Pilot
Bring us one recurring incident type. We'll help turn it into a reusable diagnostic runbook and measure time-to-root-cause before vs after. 1 to 3 teams this quarter.
Pick one incident type
Disk full. API 500s. Queue backlog. The one your on-call keeps seeing.
We build the runbook with you
Real commands against your stack. AI interpretation. Human review for anything risky.
Measure before vs after
We track time-to-root-cause across the next 3 incidents. You decide if it's worth keeping.
We'll reply within one business day with a 30-minute fit call.